I have been absolutely terrible at keeping things up-to-date, and I have to keep playing catch up. Thank you for bearing with me! I’m down to nine days left here in Norway, so it may be even worse as my final is coming up in a week from today.
We will start our journey with Monday of last week, July 14th. On that day, Dr. Aage Stangeland with the Research Council of Norway visited us to talk about Carbon Capture and Sequestration (CCS). While I’ve heard about CCS, I didn’t have an opinion one way or the other on the technology. CCS works by capturing CO2 from power plants, which requires heat to separate it from other gasses. The CO2 then needs to be transported and injected 800 meters below ground, where it’ll be under so much pressure that it turns into a liquid. Here, it is stored in soft rock with hard rock above. It requires a specific formation that is not near faults, has soft rock to store the CO2 with the protective layer of hard rock with no fissures. Aage then showed us how the Bellona Foundation, a NGO, work to promote CCS around the world and to inform citizens that CCS is actually not harmful and create a dialogue between politicians, industry, and citizens. To be honest, I am not sure I am a fan of CCS. I believe that it is safe, and it is useful – but it is not something we should rely on. New power plants should probably consider or be required to use CCS to help eliminate some CO2 from the atmosphere. However, we need new sources of energy that are not CO2 intensive; we should not be relying on CCS technology to solve our carbon emission problem. I feel that promoting CCS may make us feel that we are doing enough toward helping our climate, when that is not the case.
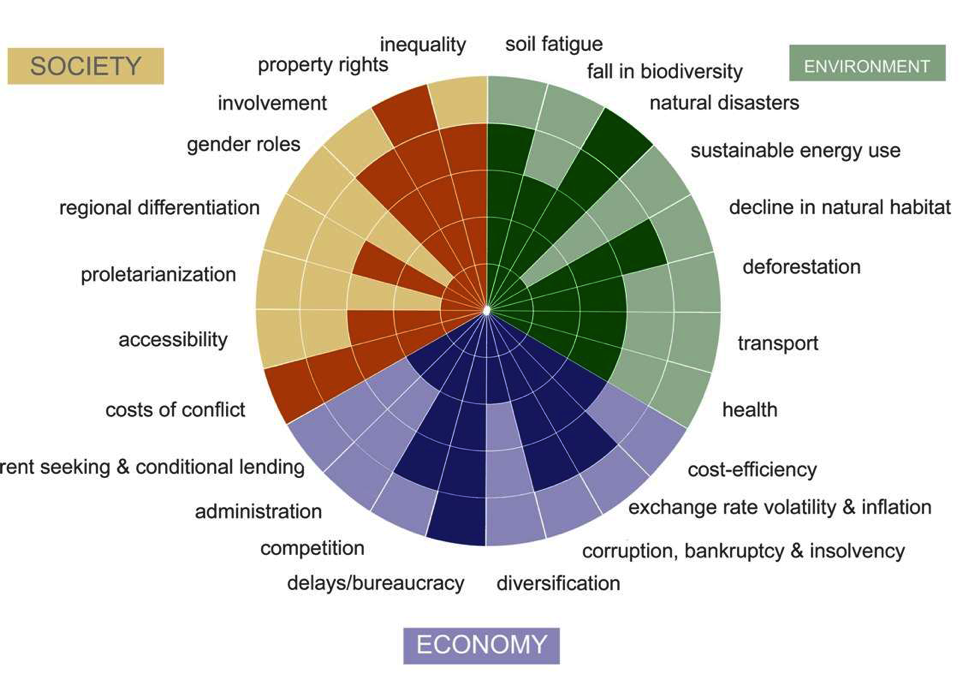
On Tuesday, we learned more about using value maps for sustainability. There are three components to the value map – Ecology, Society, and Economy. Each part has several sub-parameters. Ecology parameters are mostly similar across all contexts, while the society and economy parameters can vary from place to place. While this map is not objective, it makes us think and provides us with ways to measure what is happening in our own localities. It can be used to measure a community’s sustainability efforts or a technology’s sustainable potential. Also called a spider value map (and are used in policy analysis sometimes, too), it helps us to think holistically. Below are some examples of value maps for a few projects, just so you can see what these look like.


On Wednesday and Thursday, we had the most wonderful, older Danish gentleman, a professor in Denmark, come and talk to us about energy and environment. Jørgen Nørgård covered a lot of ground in the two days he was with us. The first concept he covered was the crucial role of energy savings versus supply. Our earth is a closed system except for energy – the sun helps to power us, whether it was sun millions of years ago, trapped as oil, sun this last year that made food, or sun right now in solar PV. The most sustainable thing to do around energy is to create energy savings by changing behavior, our structure, and the technology we use. Of course, renewable energy technologies, like solar and wind, are also better than fossil fuels, but the most energy savings can come from these behavioral, structure, and technology are most important. He showed us an Energy Chain to show us how we can target electricity. For example, electricity use can be targeted when you change the primary source of energy. You could target the technology of the power plants or the technology behind end-use products.

The second concept Jørgen covered was the technology options we have in end-use energy savings. He was part of a Danish group that made a more energy efficient refrigerator in the 1970s that did not become more popular until the late 1990s. There are many appliances we use, such as refrigerators, ceiling fans, and cooking equipment that can save quite a bit of energy with simple design changes. One of the best quotes from Jørgen’s trip as that we have used technology to create time-saving devices, such as washing machines, which has now led to the creation of brain-washing machines – aka TVs and other things that are time spending machines. Energy saving measures and policies that help to implement better technologies including taxes, especially on energy use, labeling of energy efficiency, enforcing minimum efficiency standards. However, knowing where in the chain to implement the policies is important to make sure that the proper actors are forced to make changes.
Yet another concept is optimizing the economic chain from resources to satisfaction (the energy welfare component at the ultimate end of the above diagram). Our economic system has us think in terms of overall cost instead of using our resources in the best way. It’s built in such a way that we have a hard time limiting consumption in those countries that are already consuming so much. But if the developing nations want a chance at what the U.S. and Europe have, who are we to deny that to them? The EU and USA would have to reduce consumption by 1/10th for it to be more equitable. He then explained a simple model to help us see environmental impact. Impact, I, is equal to Population (P) x Affluence (A) x Technology (T). If you just target one of these things, you aren’t reducing the volume of the impact by much. Targeted interventions that focus on more than one section are need. In this lecture, one of the most poignant things he said was “Why leave children to a life fighting for resources and deprived of Nature’s wonders? Have fewer children because you love them!” While I feel like this language might be too strong, I certainly see this as an issue. From there, we seemed to diverge into built-in obsolescence in our products and how that contributes to GDP, but not to our conservation of natural resources. I think this is a major issue; I definitely see that clothing and electronics do not necessarily last as long as they used to, and parts aren’t always readily replaceable.
He also discussed historical environmental movements and developments – he was actually an adult for some of them, like the “Limits to Growth” debate. He showed that we are on track with the ‘Collapse’ scenario provided in “Limits to Growth.” His main examples came from Denmark, which had cut down all but 2% of its forests by 1800 and was dependent on fossil energy imports from elsewhere. After discovering oil in the 1980s, Denmark became self sufficient in energy by 1997. First, they reduced demand and used combined heat and power plants to use oil and gas more efficiently. More recently, they have been using wind to cover some of their electricity needs. Denmark has hopes to be totally carbon free by 2050. However, how do they get there?
Jørgen covered scenario creation as a way to show what we want to have happen in the future. He explained that there is a difference between prognoses, which use trends of the past to predict the future, and scenarios that need vision and thoughts of the future, not just using the past to create the future. For example, such a vision was putting the man on the moon or steam flight from America to Europe. While steam flight hasn’t happened, there have been flights across the Atlantic (I took one just over a month ago!) and we have put a man on the moon. There is obviously some value in thinking of what we want to see in the future and then putting that in place, instead of using past trends to “see” the future wants and needs.
We rounded out the week with Natalija Špeh from Slovenia, who talked about sustainable landscape management in the Šalek Valley. This valley has a coal seam that runs through it and has power plants in the area, too, producing 30% of Slovenia’s electricity. There are also a lot of industries located in this valley, as this is the prime location of electricity in the region. However, due to the valley shape, pollution stays trapped, especially during the wintertime as cold air in the valley is trapped by warm air from the mountains. From these facts, she told us about sustainable management, which focuses on the long term, integrated evaluation, and assessing both positive and negative consequences. These can use both quantitative – such as the percent changes in land use, certain sectors that are growing, etc. – and qualitative measures – such as opinions on proposed intervention and the ideas of the affected population. She then showed us an area of the Šalek Valley that is going through a process of redevelopment around a lake that formed from a depression created by the extraction of coal. We drew pictures of the area and our own ideas for what that area should look like, especially as Slovenia is focusing on increasing tourism (“I feel Slovenia” is there slogan). I love the Chain of Lakes in Minneapolis, so I created something like that, but with fewer houses nearby.
Phew, through all of last week! Now onto this week.
On Monday, we learned more about sustainable cities and traditional settlement patterns from our main instructor, Chris Butters. The most traditional is the cluster village. In Norway, these villages were built up on the hillside, sometimes into the hillside, to leave the flatter areas near water bodies for agriculture and for pastureland. In the U.S. the Pueblo cities were mentioned for the fact that the buildings utilized natural ventilation. Traditional European medieval towns were built together on areas that also avoided prime agricultural lands. In the industrial age, zoning, urban sprawl, and planning characterize modern cities. But some shortcomings include no center for some, segregation, and poor quality of certain areas. Modernism especially was designed around some cars but had set places for services instead of using more mixed use. Now, there are certain cities (defined as 5,000-20,000 people) that are trying to become zero emission cities, including a neighborhood of Helsinki (Vikki), and Malmø, Sweden’s Western Harbor. More sustainable building design utilizes integrated ecological planning, taking consideration to bioclimatic design, passive and active solar use, and space for alternative modes of transportation. Oftentimes sustainable cities survive longer with stakeholder participation. This does not mean informing or just consultations with the public. Instead, it needs citizen control and delegated power to the people. He then went through multiple other examples, including district cooling used by Cornell University!
On Tuesday, we continued with our discussion of sustainable development around the quote from Article 21 of the Rio Convention: “For sustainable development to succeed, it must be anchored and implemented, locally.” We focused specifically on this locally component and how sustainable initiatives have to be developed from the bottom up. One example is the Ideas Bank Foundation, which distributes sustainable ideas, information on technology, and program examples globally. We also covered some small towns, such as Albertslund in Copenhagen and Samsø Island off of Denmark and how they created their own goals through community workshops, all at the local level. There are also a few institutional local ideas, such as Barefoot Colleges, which teach those in rural areas how to use and create green technology and buildings. The major component to remember, however, is that all four actors – business/financiers, users/community, technicians/researches, and government/authorities – need to be included when planning the process. Otherwise the sustainability plan will not necessarily move forward or last as long.
On Wednesday, we had various people from the class present on issues that aren’t covered in other parts of the course. I presented on water issues as I feel that is a point that is missing. I talked about how water is used in the production of energy, how drinking water uses energy to transport and clean, and the issues between the water-food-energy nexus (you can learn more here: http://en.wikipedia.org/wiki/Water,_energy_and_food_security_nexus). I had fun presenting on the issues I care deeply about! At the same time, I wish water issues were discussed more in the course, as it is so vital to energy, the environment, and development.
We had our group presentations on Thursday. My group presented on sustainable land use and settlement patterns in San Jose and in Bangalore. We chose these two cities as they are heavily influenced by the IT industry, with each considered to be part of the Silicon Valley in their countries. While San Jose has been getting better, Bangalore has room to expand outward which could, and has, been causing some issues.
Another group presented on emissions trading compared to clean development mechanisms (CDM). Emissions Trading was proposed under Kyoto Protocol in Article 17 while CDM was mentioned in Article 12. Unfortunately, neither became truly global. However, the EU uses an Emissions Trading Scheme (ETS), and it has been reducing emissions, but there has been overallocation of emissions permits. It is not as effective as it could be, so eliminating free allocations would be helpful. CDM allows developed nations to help developing countries with implementing new technologies and greener development. While there are other options, such as legislation and taxes, these two options are more palatable and flexible for growing economies.
The third group presented on building efficiency and architecture, comparing Mexico and Germany because they are quite different. In these places, there are various styles of vernacular buildings that used local materials and took climate into account. New buildings with passive and active designs (meaning the building works with nature to provide ventilation, heating, energy, etc.) that try to use local materials are more expensive. Therefore, there need to be incentives for people to build sustainably and locally, such as subsidies and legislation to promote change.
Our fourth presentation was on renewable energy, focusing on wind power in Kazakhstan and solar power in Bangladesh. Kazakhstan has the potential to produce around 350 GW of electricity form wind a day. This could also help with upgrading the aging infrastructure and also decreasing the CO2 emissions, as Kazakhstan is the 16th largest emitter in the world. In Bangladesh, they have 10,289 MW of installed capacity, but many people don’t have access to electricity. They have been installing solar, with 45 MW now. If only 0.07% of the incident solar is captured, they can fill all of their 15,000 MW needs. Some NGOs and institutions in Bangladesh are working on installing 1 million solar home systems around the country. Electricity allows them to run their businesses and study for school at night. Of course, there are barrier to implementation as these countries are not very wealthy. They have other issues that compete for the money that could go to renewables, such as food security, housing, transportation needs, and schooling.
Our fifth and final group will be going tomorrow. It’s 90 degrees F (32 C) out and getting hotter; with our classroom being on the 4th floor with no AC, it’s becoming unbearable. We’ll see how tomorrow goes!


